CoreUI Vue.js components helped to win a Eurostat hackathon

Just a few weeks ago, a nice gentleman from Italy sent us a message:
Dear CoreUI, I am a researcher working at ISTAT, last week I participated in European Big Data Hackathon 2021, organized by Eurostat. And we won using CoreUI Vue.js!
Sounds interesting? That’s just the beginning — let’s dig deeper, cause it’s getting hot in here…
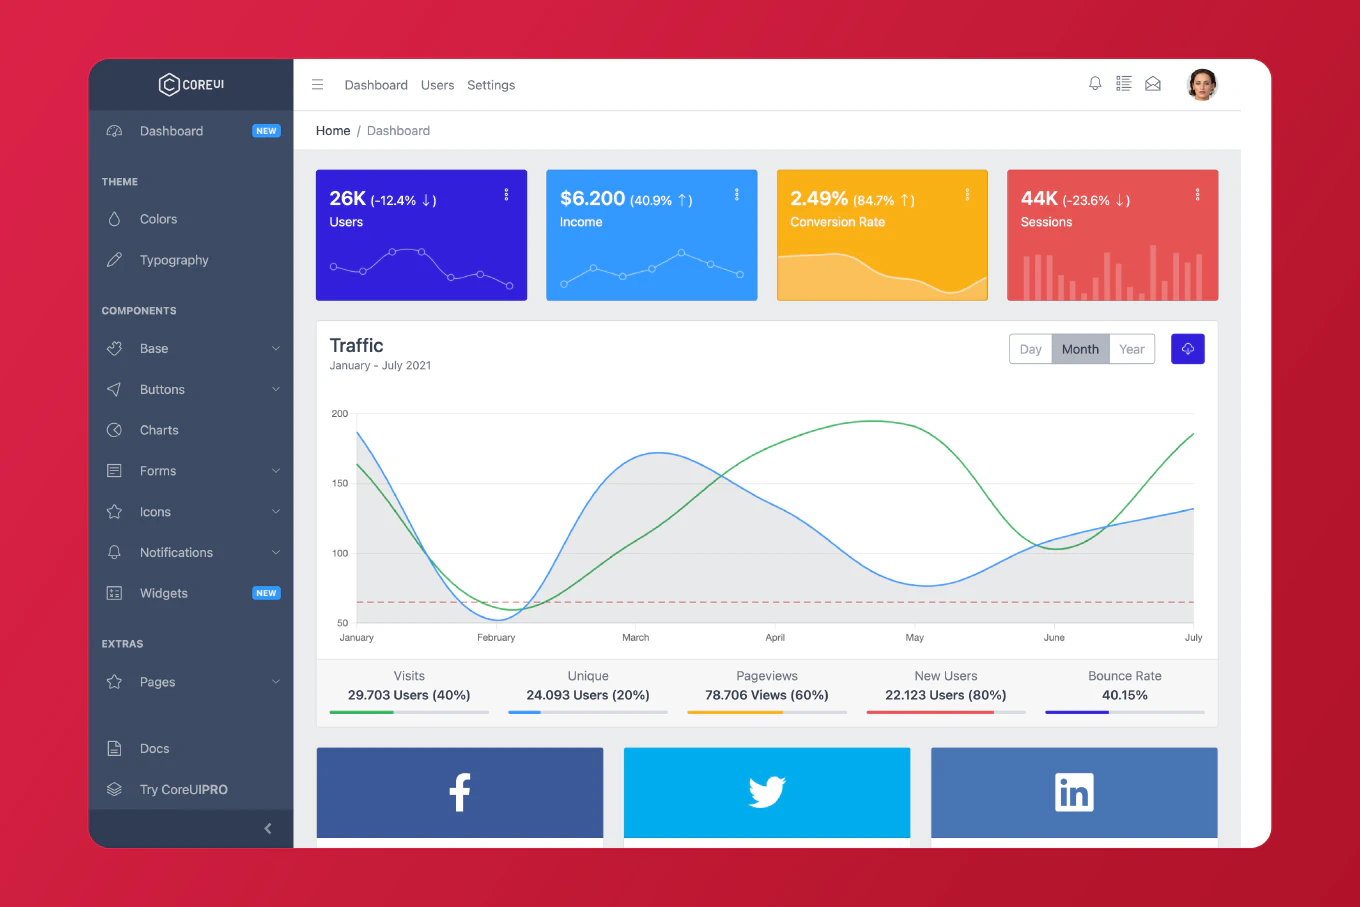
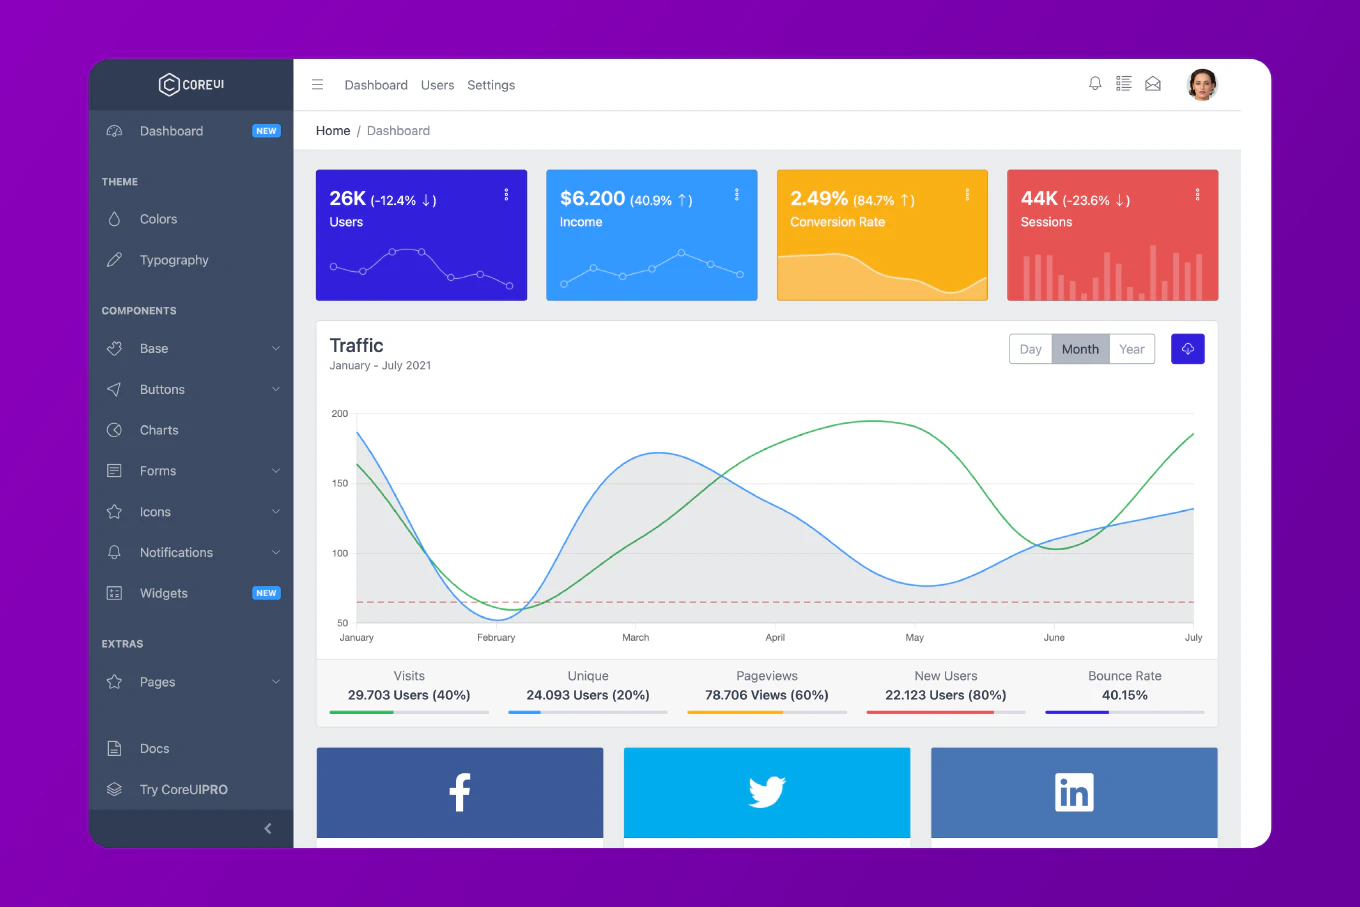
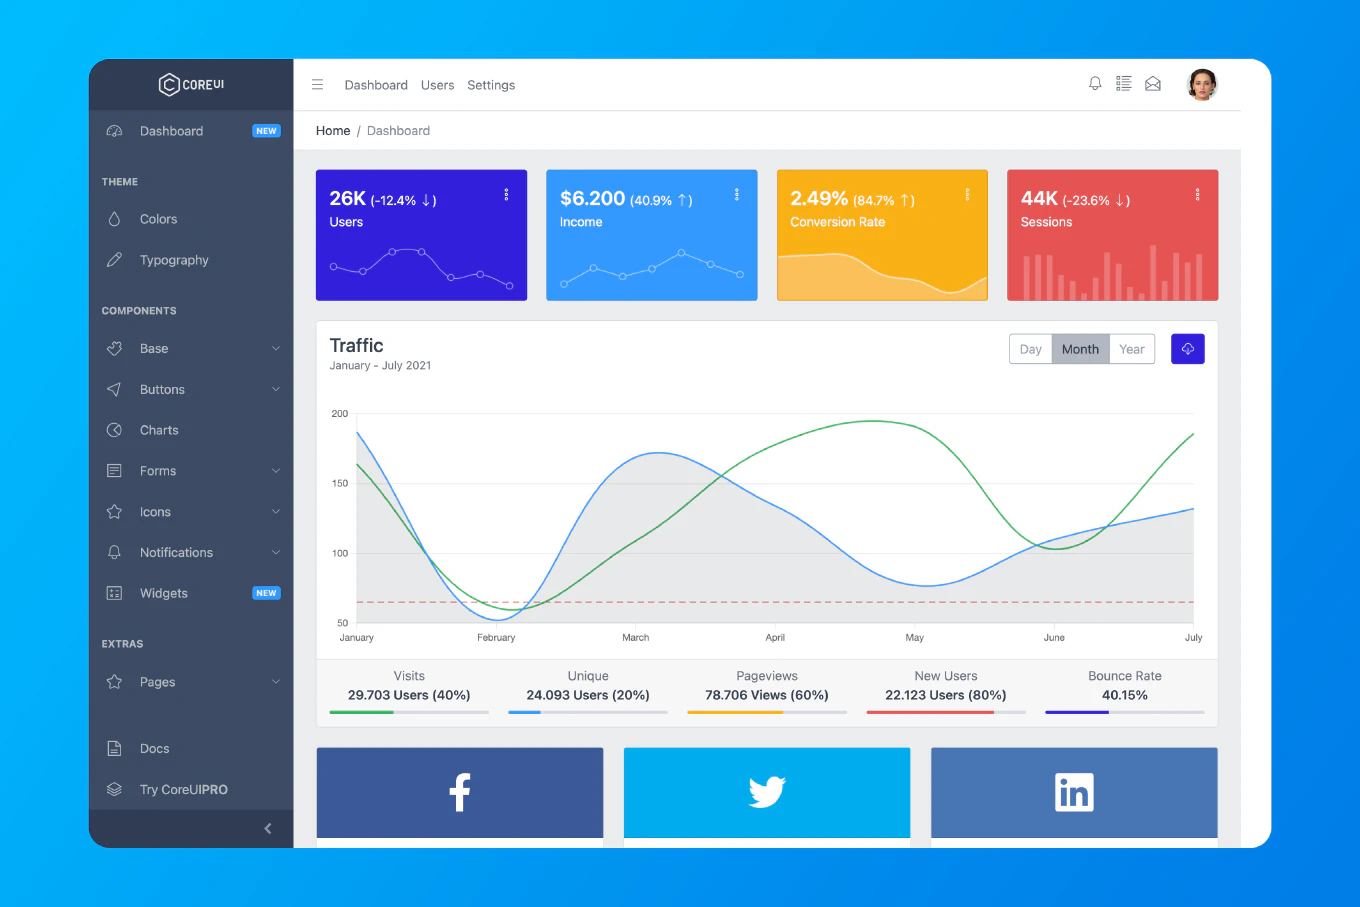
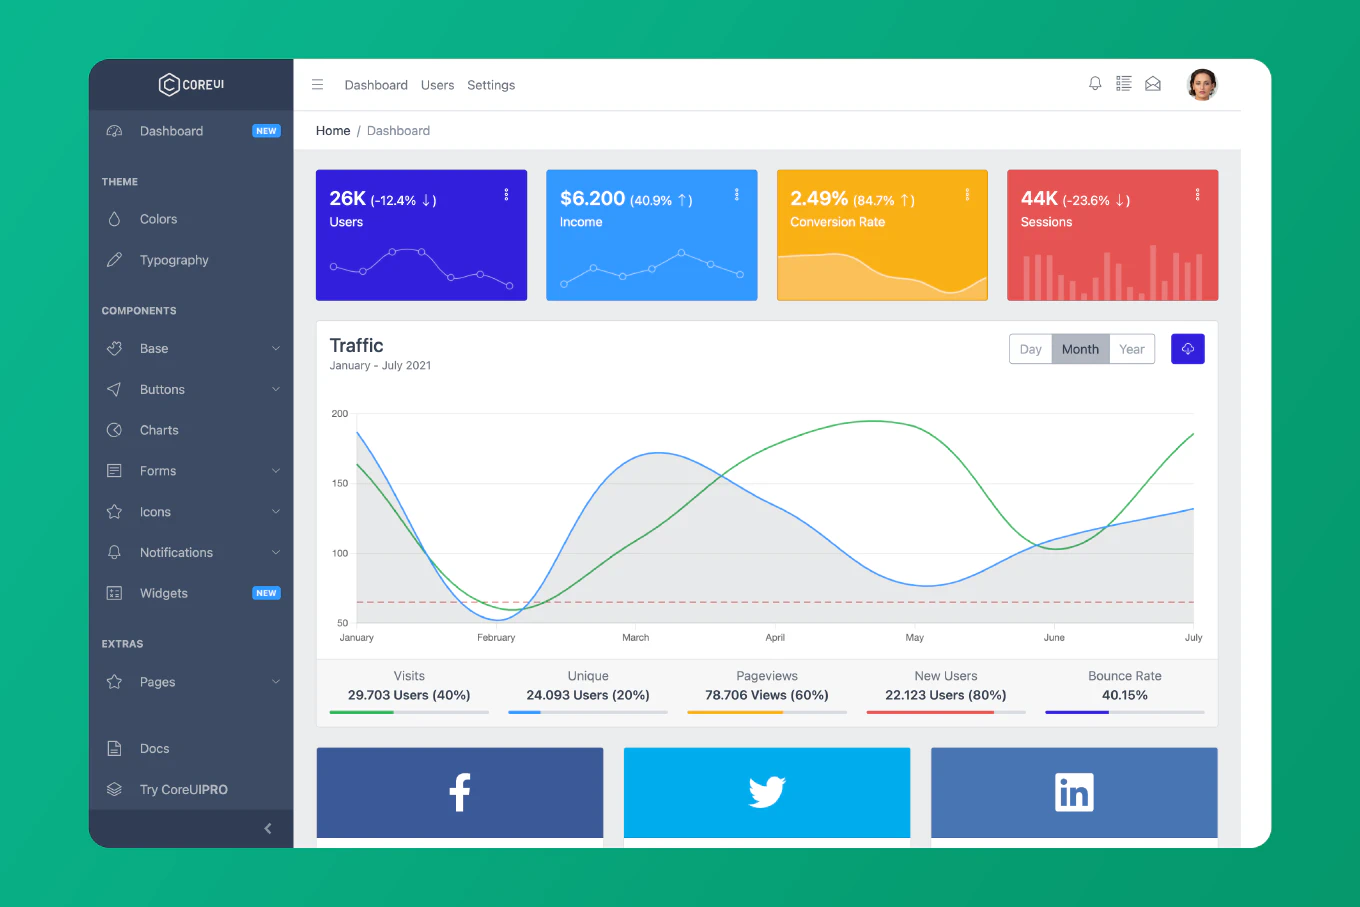
Speed up your responsive apps and websites with fully-featured, ready-to-use open-source admin panel templates—free to use and built for efficiency.
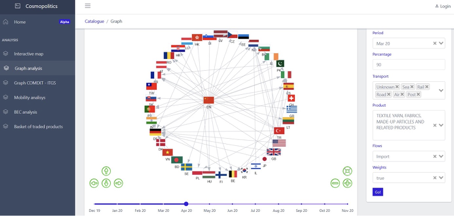
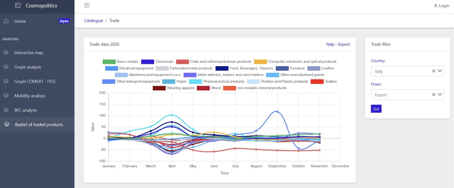
Cosmopolitics dashboard
CoreUI was a central component of ISTAT’s dashboard (Cosmopolitics), which allowed to display charts, tables, graphs, and maps containing the output produced by their data scientists.
Let’s give the mic to Mauro Bruno from ISTAT, who can tell about the project more in detail:
CoreUI offers a wonderful set of VUE components that allow building modern, modular, and super fast frontend applications. During the contest CoreUI allowed us to build a very complex dashboard in just a few days. We had experience in VUE but we needed a product containing a modern UI with Sidebar, Cards, Tables, Breadcrumbs, Buttons, Icons, and much more.
CoreUI has been the perfect choice
This excellent result and 1st place for ISTAT wouldn’t be possible without their data scientist algorithms implemented in Python and R by Barbara Guardabascio and Fabrizio De Fausti
It’s a perfect mixture of the above and of course, a modern frontend implemented thanks to CoreUI solution — adds Mauro.
European Big Data Hackathon 2021
The contest is organized by Eurostat every two years. It’s a huge conference on New Techniques and Technologies for Official Statistics (NTTS). As you can see here: https://www.youtube.com/watch?v=idwpsyiOHHU
This year the conference was held virtually from 9 to 11 of March. Before the conference, Eurostat organizes a challenge between European Statistical Institutes, i.e. European Big Data Hackathon: https://twitter.com/eu_bd_hackathon?lang=en
The main topic of the hackathon, was the analysis of the effects of the Covid Pandemic on external trade.
I was a member of Istat’s Team that won the challenge :) — adds Mauro.
As this achievement wouldn’t be possible without him and his team, let’s give him a word:
During the challenge we implemented a dashboard called Cosmopolitics, which allows us to analyze the effects of the Covid pandemic on external trade. I will not go into the methodological details of the product, that we implemented, cause for some of you it would be too boring ;) but the most interesting part is the front-end, that we implemented.
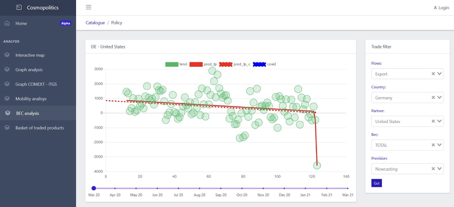
The source code of the product is available on GitHub: https://github.com/istat-methodology/cosmopolitics
I bet you all would like to take a look at Mauro’s excellent pitching presentation… It’s available on Vimeo: https://vimeo.com/525488078
All the code is public and the results of the challenge are also public, therefore we all can enjoy ISTAT’s great achievement details. Once again — BIG CONGRATS! Great job! Mauro and his teammates from ISTAT proved that our claim for CoreUI is right: ask for more
Last but not least — you can find our frontend “little hero” — CoreUI Vue.js Components here: https://coreui.io/vue/
And… that’s not all, watch this space cause v3 will be available here soon.
Very soon… with TypeScript, Composition API, and…. tbc
