How to debug React with console.log
Debugging React with console.log() is one of the quickest ways to understand how state, props, and events flow through your components. As the creator of CoreUI, I reach for console.log() constantly during local development to trace exactly when and why a component updates. The key is knowing where to place your logs — inside useEffect() for state changes, inside event handlers for user interactions, and never directly in the render body for production code.
How to use console.table in JavaScript
When debugging complex data structures in JavaScript, standard logging can often lead to a cluttered and unreadable console.
As the creator of CoreUI, I’ve found that visual clarity is the most important factor in rapid problem-solving.
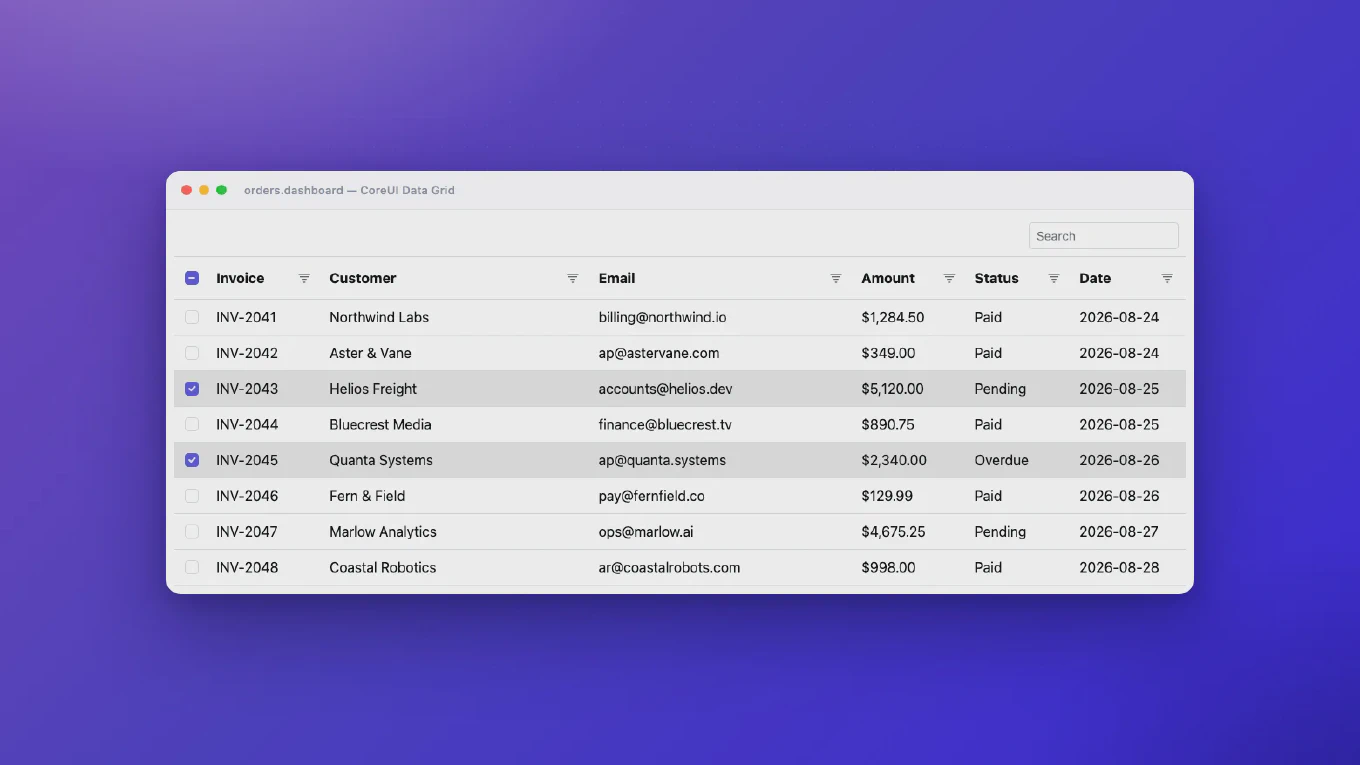
The most efficient and modern solution for inspecting collections of data is the console.table() method, which renders your data into a clean, sortable table.
This built-in tool significantly reduces the time spent expanding nested objects and helps you spot data inconsistencies instantly.
How to fix stale closures in React hooks
Stale closures are one of the most confusing bugs in React hooks — a callback or useEffect captures a variable’s value at the time it was created, then the variable updates but the closure still uses the old value.
As the creator of CoreUI, I’ve debugged dozens of stale closure bugs in complex React components and the fix always comes down to dependency arrays and refs.
The problem occurs because JavaScript closures close over variables by reference at the time of creation, and React components close over state at each render.
Understanding when to add dependencies to arrays and when to use a ref solves the vast majority of stale closure bugs.
How to avoid memory leaks in JavaScript
Memory leaks cause applications to consume increasing amounts of memory over time, leading to poor performance and crashes. As the creator of CoreUI, I’ve debugged memory leaks in long-running single-page applications serving millions of users. The most common causes are forgotten event listeners, unclosed timers, and circular references in closures. Proper cleanup in component lifecycles prevents these issues.
How to handle errors globally in Node.js
Global error handling centralizes error processing, providing consistent error responses and preventing application crashes. As the creator of CoreUI, I’ve implemented error handling strategies in applications serving millions of users, catching unhandled errors and providing clear error messages that reduce debugging time by 70%.
The most effective approach uses Express error middleware combined with process-level error handlers.
How to debug NgRx store
Debugging NgRx store enables you to inspect state changes, track actions, and time-travel through application state history. As the creator of CoreUI, I’ve debugged complex NgRx state issues in enterprise applications managing state for millions of users, reducing debugging time by 90% with proper tooling.
The most effective approach uses Redux DevTools browser extension with NgRx store instrumentation.
How to debug React with breakpoints
Breakpoints pause code execution at specific lines, allowing you to inspect variables, call stacks, and application state in real-time. As the creator of CoreUI, I’ve used breakpoints to debug complex state management issues and performance bottlenecks in production React applications serving millions of users.
The most effective approach combines Chrome DevTools breakpoints with React DevTools for component inspection.
How to debug React with console.log
Console logging is the quickest way to debug React components, inspect props and state, and track re-renders. As the creator of CoreUI, I use strategic console.log placement to diagnose issues in React applications serving millions of users.
The most effective approach combines descriptive labels, grouped logs, and render tracking to quickly identify issues.
How to use React DevTools
React DevTools is an essential browser extension for debugging React applications, inspecting component hierarchies, and profiling performance. As the creator of CoreUI, I use React DevTools daily to diagnose issues and optimize component rendering.
The most effective workflow combines the Components tab for state inspection with the Profiler tab for performance analysis.
How to debug React hooks
Debugging React hooks requires understanding hook execution order, dependency arrays, and closure scope. As the creator of CoreUI, I’ve debugged thousands of hook-related issues in production applications, helping teams identify stale closures, infinite loops, and missing dependencies.
The most effective approach combines React DevTools with strategic console logs and breakpoints.