How to use console.table in JavaScript
When debugging complex data structures in JavaScript, standard logging can often lead to a cluttered and unreadable console.
As the creator of CoreUI, I’ve found that visual clarity is the most important factor in rapid problem-solving.
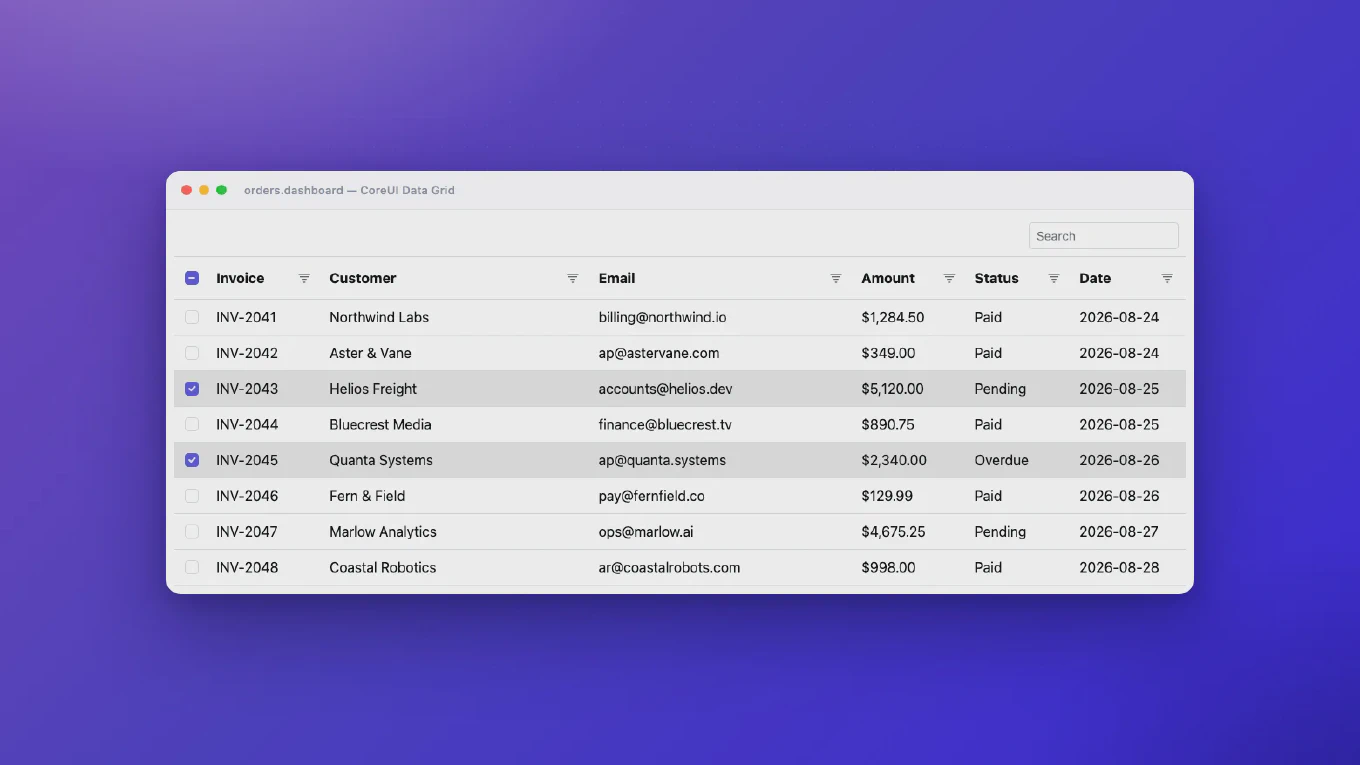
The most efficient and modern solution for inspecting collections of data is the console.table() method, which renders your data into a clean, sortable table.
This built-in tool significantly reduces the time spent expanding nested objects and helps you spot data inconsistencies instantly.
How to profile React rendering
React Profiler measures component render times and identifies performance bottlenecks in your application. As the creator of CoreUI, I’ve used React Profiler to optimize applications serving millions of users, reducing render times by up to 80% by identifying and eliminating unnecessary re-renders.
The most effective approach combines React DevTools Profiler with the Profiler API for production monitoring.
How to debug React with breakpoints
Breakpoints pause code execution at specific lines, allowing you to inspect variables, call stacks, and application state in real-time. As the creator of CoreUI, I’ve used breakpoints to debug complex state management issues and performance bottlenecks in production React applications serving millions of users.
The most effective approach combines Chrome DevTools breakpoints with React DevTools for component inspection.
How to use React DevTools
React DevTools is an essential browser extension for debugging React applications, inspecting component hierarchies, and profiling performance. As the creator of CoreUI, I use React DevTools daily to diagnose issues and optimize component rendering.
The most effective workflow combines the Components tab for state inspection with the Profiler tab for performance analysis.
How to debug React hooks
Debugging React hooks requires understanding hook execution order, dependency arrays, and closure scope. As the creator of CoreUI, I’ve debugged thousands of hook-related issues in production applications, helping teams identify stale closures, infinite loops, and missing dependencies.
The most effective approach combines React DevTools with strategic console logs and breakpoints.
How to profile Vue performance
Profiling Vue application performance identifies rendering bottlenecks, slow components, and unnecessary re-renders for targeted optimization. As the creator of CoreUI, I’ve profiled and optimized numerous production Vue applications. Vue DevTools combined with browser Performance API provides detailed insights into component render times, lifecycle hooks, and reactive updates. This approach reveals performance issues enabling data-driven optimization decisions for faster user experiences.
How to debug Vue lifecycle hooks
Debugging Vue lifecycle hooks helps understand component behavior, timing issues, and execution order during initialization and updates. As the creator of CoreUI, I’ve debugged countless lifecycle issues in complex applications. Vue lifecycle hooks execute at specific moments in component lifecycle providing insight into mounting, updating, and unmounting phases. This approach reveals timing issues, state problems, and helps optimize component performance.
How to debug Vue with DevTools
Debugging Vue applications with Vue DevTools provides powerful inspection of components, state, events, routing, and performance profiling. As the creator of CoreUI, I’ve used Vue DevTools extensively for debugging complex applications. Vue DevTools browser extension integrates with Chrome and Firefox, offering real-time component inspection and time-travel debugging. This approach makes debugging Vue applications significantly faster with visual component hierarchy and reactive data tracking.
How to profile Angular performance
Profiling Angular applications identifies performance bottlenecks in rendering, change detection, and component initialization. As the creator of CoreUI, I’ve optimized numerous slow Angular applications. Chrome DevTools and Angular DevTools provide profiling capabilities to measure component render times and change detection cycles. This approach helps you identify and fix performance issues before they impact users.
How to debug Angular with Augury
Debugging Angular applications with Augury provides visual inspection of component hierarchy, state, and dependency injection. As the creator of CoreUI, I’ve used Augury to debug complex component trees in enterprise applications. Augury is a Chrome and Firefox extension that extends browser DevTools with Angular-specific debugging capabilities. This approach helps you visualize component relationships, inspect properties, and understand application structure.