Bootstrap Data Table: When a Plain Table Stops Being Enough
 Łukasz Holeczek
Follow Łukasz Holeczek on GitHub
Connect with Łukasz Holeczek on LinkedIn
Follow Łukasz Holeczek on X (Twitter)
Łukasz Holeczek
Follow Łukasz Holeczek on GitHub
Connect with Łukasz Holeczek on LinkedIn
Follow Łukasz Holeczek on X (Twitter)
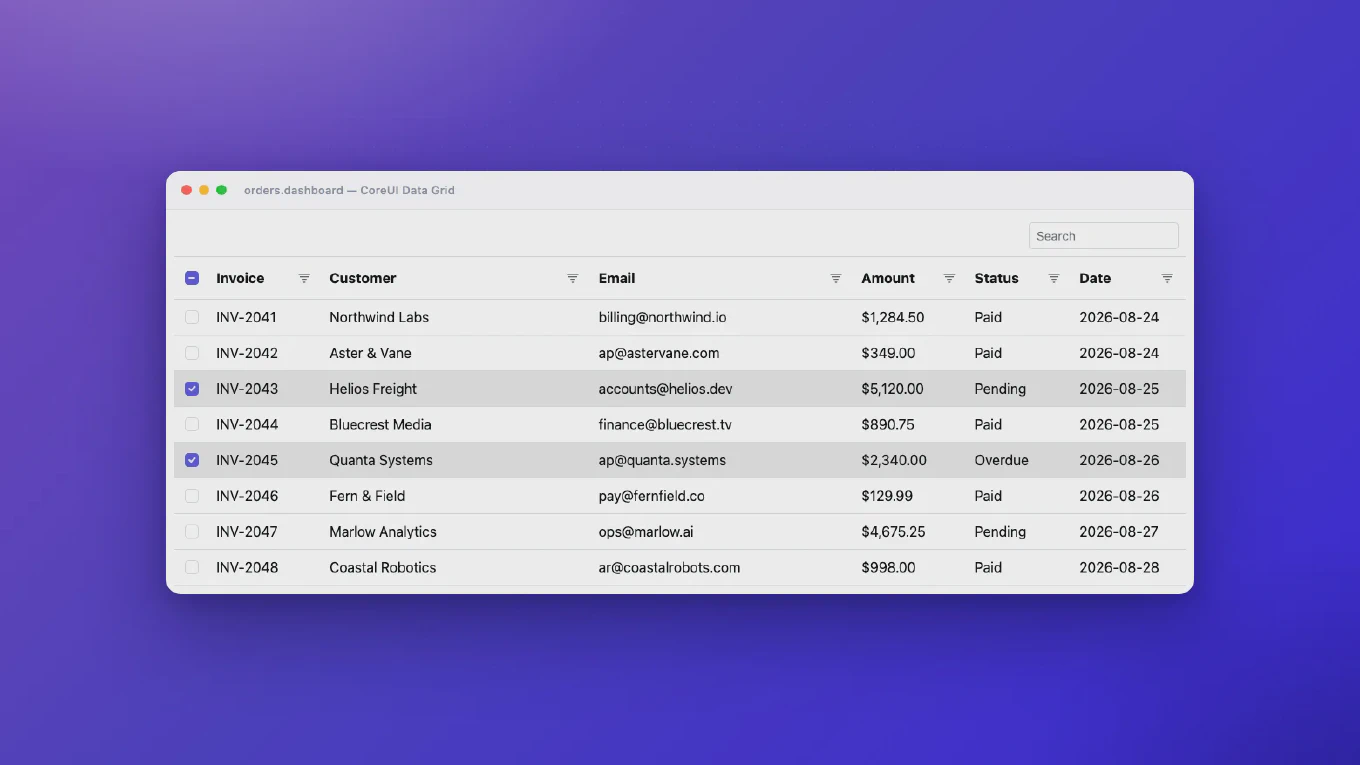
Every Bootstrap data table starts the same way: a <table class="table">, a
loop over some rows, done. And for a surprising number of applications, that
is genuinely all you need.
Then the requirements arrive one at a time. “Can we sort this by date?” “Can I search it?” “It’s slow with this quarter’s data.” Each one looks small, and each one is answerable with a few lines of JavaScript — until, at a fairly predictable point, it isn’t.
This article walks that ladder honestly. For each threshold we show what you can build yourself with plain Bootstrap (or CoreUI, which shares the same table markup and classes) and vanilla JavaScript, where the hand-rolled version starts to leak, and at which rung it stops being reasonable to keep writing table infrastructure by hand. If your table has 50 rows and never will have more, the code below is all you need — no library, no license, nothing to ship but a few kilobytes of your own JavaScript.
Speed up your responsive apps and websites with fully-featured, ready-to-use open-source admin panel templates—free to use and built for efficiency.
Rung 0: the plain Bootstrap table
Bootstrap’s table styles are opt-in: add .table to get the base styling,
and modifiers like .table-striped, .table-hover, or .table-sm as
needed. Wrap it in .table-responsive and it scrolls horizontally on small
screens instead of breaking your layout:
<div class="table-responsive">
  <table class="table table-striped table-hover" id="users">
    <thead>
      <tr>
        <th scope="col">Name</th>
        <th scope="col">Role</th>
        <th scope="col">Joined</th>
      </tr>
    </thead>
    <tbody>
      <tr><td>Alice Ray</td><td>Admin</td><td>2024-03-14</td></tr>
      <tr><td>Bob Chen</td><td>Editor</td><td>2023-11-02</td></tr>
      <!-- … -->
    </tbody>
  </table>
</div>
What this gives you: consistent, responsive, dark-mode-aware presentation. What it doesn’t give you: any behavior at all. Bootstrap is a CSS framework; a “bootstrap datatable” in the sense most people search for — sortable, filterable, paginated — is Bootstrap’s markup plus JavaScript that someone has to write. The question of this article is when that someone should be you.
Rung 1: Bootstrap table sorting
The first request is almost always sorting. Here is a complete, dependency-free implementation — click a header to sort, click again to reverse:
const table = document.getElementById('users')
const tbody = table.tBodies[0]
const collator = new Intl.Collator(undefined, { numeric: true })
let currentIndex = null
let direction = 1

table.querySelectorAll('thead th').forEach(th => {
  th.style.cursor = 'pointer'
  th.addEventListener('click', () => {
    direction = th.cellIndex === currentIndex ? -direction : 1
    currentIndex = th.cellIndex

    const rows = [...tbody.rows].sort((a, b) =>
      direction * collator.compare(
        a.cells[currentIndex].textContent.trim(),
        b.cells[currentIndex].textContent.trim()
      )
    )
    tbody.append(...rows)
  })
})
Twenty lines, and Intl.Collator with numeric: true even sorts “Row 9”
before “Row 10”. For a table of a few hundred rows this is a perfectly good
answer, and you should feel no pressure to reach for anything heavier.
Where it starts to leak:
- Types. Everything is compared as text. Dates in
DD.MM.YYYYformat, currencies with symbols, or percentages will sort wrong until you write per-column parsing — which means per-column configuration, which means you are now designing a column model. - Accessibility. Screen readers need
aria-sorton the active header and a visible direction indicator; both are your job now. - Multi-column sorting (“by department, then by salary”) roughly doubles the state you track.
None of these are hard individually. They are the first small payments on a mortgage you have just taken out.
Rung 2: Bootstrap table filtering
Next comes the search box. The naive version is even shorter than sorting:
<input class="form-control mb-3" id="search" type="search"
       placeholder="Search users…">
document.getElementById('search').addEventListener('input', event => {
  const query = event.target.value.trim().toLowerCase()
  for (const row of tbody.rows) {
    row.hidden = query !== '' &&
      !row.textContent.toLowerCase().includes(query)
  }
})
A global contains-filter across every column, live as you type. Again: for hundreds of rows, ship it.
The leak here is different in kind, not just in degree. The moment filtering
and sorting coexist, the DOM stops being a truthful data store. Hidden
rows still get sorted; sorted rows need to stay hidden; “showing 12 of 340
results” needs a count that lives somewhere. And the first time someone asks
for a per-column filter — salary between X and Y, department is one of
these three — plain string matching is over: you need typed operators
(text/number/date), a filter UI per column, and a way to combine conditions.
At this rung the honest move is to stop manipulating <tr> elements and
keep your data in an array, re-rendering the table from state. Which brings
us to rung 3, because that refactor is exactly what pagination forces
anyway.
Rung 3: pagination — where DIY becomes a framework
Once the array is the source of truth, pagination is a slice:
const state = { query: '', sortKey: null, direction: 1, page: 0, pageSize: 20 }

function view(items) {
  let rows = items.filter(matches(state.query))
  if (state.sortKey) rows = rows.toSorted(compare(state.sortKey, state.direction))
  const start = state.page * state.pageSize
  return { rows: rows.slice(start, start + state.pageSize), total: rows.length }
}
Notice what happened: you are no longer writing “a bit of JavaScript on top of a table”. You have a state object, a derivation pipeline (filter → sort → paginate), a render function, and a growing set of rules — changing the filter must reset the page, changing the page size must re-clamp the current page, the pager needs first/last/ellipsis logic, the range label needs “Showing 21–40 of 613”. Each rule is trivial; the set of them is a small framework, and it is now yours to test and maintain.
This is the honest inflection point of the whole ladder. Below it, hand-rolling is clearly right. Above it, you are choosing between maintaining your own mini data grid or adopting one that someone else keeps correct. Both are legitimate choices — the difference is whether table behavior is your product or a chore next to your product.
Rung 4: ten thousand rows
At some row count the conversation changes from correctness to physics. A
10,000-row table with 8 columns is on the order of 200,000 DOM nodes once
you count cells and their contents. The browser will build it — and then
every layout pass, every style recalculation, every tbody.append(...rows)
re-sort pays for all of it. Sorting that felt instant at 500 rows takes
seconds; scrolling stutters; on a mid-range laptop the tab audibly spins up
the fans.
Pagination hides this problem rather than solving it — only one page is in the DOM, so the browser is fine. If discrete pages fit your users’ mental model (admin lists, order histories), pagination over an in-memory array is a genuinely fine terminal state, and you can stop climbing here.
But users increasingly expect the other model: one continuous scroll through the full dataset, with sorting and filtering that still apply to all of it. That expectation has exactly one implementation:
Rung 5: virtualization — the rung you should not build
Virtualization renders only the rows currently in view (plus a small buffer), positions them inside a scroll container sized as if every row were present, and recycles them as you scroll. The DOM stays at ~30 rows whether the dataset is 1,000 or 100,000.
It is also the rung where hand-rolling stops being a reasonable weekend project. A correct virtualizer has to keep scrollbar geometry stable, handle variable row heights, survive resize and zoom, keep keyboard navigation and accessibility working for rows that don’t exist in the DOM, and stay in sync with sorting and filtering that run across the full dataset — not just the rendered window. This is precisely the point where a data grid earns its existence.
For Bootstrap projects this is what CoreUI Data Grid
is for — it styles itself on the same .table conventions (via the CoreUI
stylesheet, or a self-contained standalone stylesheet on plain Bootstrap
pages), so it drops in without a redesign:
import { DataGrid } from '@coreui/data-grid'
import '@coreui/data-grid/dist/css/data-grid.css'

new DataGrid(document.getElementById('grid'), {
  columns: [
    { key: 'name', label: 'Name' },
    { key: 'department', label: 'Department', filterType: 'select' },
    { key: 'salary', label: 'Salary', filterType: 'number' },
  ],
  items,                    // 100,000 rows is fine
  itemKey: item => item.id,
  columnFilters: true,      // per-column filter dialogs with typed operators
  globalFilter: true,       // the search box from rung 2, done properly
})
Everything on the ladder above is the default or a single option: sorting is
on by default (shift+click for multi-column), virtualization is on by
default and handles 100,000 rows, and if your users prefer discrete pages,
pagination: true switches the grid out of windowed scrolling — the two
modes are mutually exclusive, matching the rung-4 trade-off exactly. Past
the ladder there is the next set of requests you haven’t gotten yet: row
selection, inline editing, CSV export, column pinning and reordering, and
server-side data for datasets that shouldn’t be in the browser at all. The
vanilla core is ~48 KB gzipped, with React, Vue, and Angular bindings that
share the same API and stylesheet.
CoreUI Data Grid is a commercial component — $199 per developer during early access. That is the honest trade at this rung: you are paying to not own the code from rungs 1–5, plus the rungs after them.
Where to stop climbing
| Your situation | Honest answer |
|---|---|
| ≤ a few hundred rows, sort or search “would be nice” | Plain Bootstrap table + the snippets above. No library. |
| Hundreds to a few thousand rows, discrete pages are fine | Array-as-state + filter/sort/slice pipeline. Still yours to maintain, still reasonable. |
| Per-column typed filters, multi-column sort, “show all of it” scrolling | You are building a data grid. Decide deliberately whether to own one. |
| 10,000+ rows, full-dataset sort/filter, selection, editing, export | Use a grid with virtualization — CoreUI Data Grid if you’re in the Bootstrap/CoreUI ecosystem. |
The plain Bootstrap table is not a lesser version of a data grid — it is the correct tool for the majority of tables, which are small, read-only, and better off without a dependency. The mistake is not starting simple; the mistake is not noticing which rung you are on when the fifth “small” request lands.